Mathematics 216 Computer-oriented Approach to Statistics
Computer Lab 2
with Guided Solutions (Technology Manual)
Activity 1. Empirical Probability: Compute probabilities involving one variable
Chapter 3 of your eText notes that one method of deriving probabilities for an event is to compute the relative frequency of the event after the related probability experiment has occurred numerous times in the past. This method is called the Empirical Method of deriving probabilities.
You will open up the StatCrunch data file Field Goal Data for the 2013 NFL Season, which contains data relating to all the NFL field goals that occurred during the 2013 season. One could view the probability experiment that generates this data as “an NFL field goal play is executed and one is interested in the outcome of the play”.
You will focus on the one variable Outcome of the field goal as the event of interest. This event has three possible outcomes regarding the result of the field goal: “made” or “missed” or “blocked”. A quick way to empirically derive the probability of each of the three outcomes is to create a frequency distribution table of the variable “Outcome” which displays the relative frequencies of each outcome.
The StatCrunch data file called Field Goal Data for the 2013 NFL Season has already been saved to a StatCrunch Group folder called AU Math216 2020 on the StatCrunch website.
Task 1. Exercise: Empirical Probability
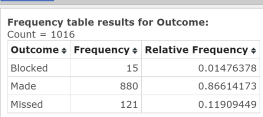
Compute the probabilities of different outcomes related to the execution of an NFL field goal play in 2013. To do this, you will use StatCrunch to create the frequency table displaying frequencies and relative frequencies for the variable Outcome in the data file Field Goal Data for the 2013 NFL Season, as displayed in Figure 1 below.

Figure 1. Frequency table for variable “Outcome”
Guided Solution 1a
- Open the StatCrunch data file Field Goal Data for the 2013 NFL Season located in the StatCrunch Group folder called AU Math216 2020. If the group is not found, type “2020” in the Browse All box and hit Enter; then click on “AU Math216 2020”. (For help accessing this resource, see Accessing and Working in StatCrunch on the course home page.)
- Click Field Goal Data for the 2013 NFL Season to open the data table.
Guided Solution 1b
Create a frequency table for the variable Outcome.
- Click the menu sequence Stat → Tables → Frequency.
- In the Frequency Table window that displays:
- In Select column box, click on the variable Outcome.
- In the Statistics box, hold the Ctrl key down while clicking on Frequency and Relative Frequency.
- In the Order by box, select Value Ascending.
- Click Compute to display the Frequency Table as displayed in Figure 1 above.
Guided Solution 1c
- Create a new word processing file and name it ComputerLab2. Use a software that will allow you to later safe your file as a PDF. Type in the subheading: Frequency Table: Filed Goal Outcomes.
- Copy the frequency table into a new Word file called ComputerLab2 under the subheading created above. (For help with copying StatCrunch data, see Copying Materials from StatCrunch.)
- As you will later be asked to copy other solutions into this file, we suggest that you save this file on your hard drive, inside a folder called Math 216. Note that you will NOT be asked to send this file to your tutor.
Task 2. Interpretation Question: Empirical Probabilities: Field Goal Data for the 2013 NFL Season
Copy and paste the questions below into your ComputerLab2 Word file, below the frequency table you just pasted in.
Based on your review of the pasted frequency table, type your answer to each question after the word Solution. (If you need help answering these questions, see the Solutions section that follows them.)
For each of the following, consider the probability experiment where one is about to witness an NFL Field Goal Play in the 2013 Season and is focused on the outcome of the play.
Find the probability that:
the field goal is “made” (successful).
Solution:
the field goal is “blocked” (successful).
Solution:
the field goal is “missed” (successful).
Solution:
the field goal is “not made”.
Solution:
Remember to save your Word file ComputerLab2.
Solution 2
- Here we use the relative frequency of the outcome “made” in Figure 1, which is 880/1016 = .86614173
- Here we use the relative frequency of the outcome “blocked” in Figure 1, which is 15/1016 = 0.01476378
- Here we use the relative frequency of the outcome “missed” in Figure 1, which is 121/1016 = 0.11909449
- Find 1 − P(“made”) = 1 − .86614173 = 0.133858
Activity 2. Empirical Probability: Compute probabilities involving multiple variables
Here we examine probability experiments in which we focus on the outcome of two or more variables each time the experiment is performed. For these experiments, the relative frequencies (probabilities) can be easily computed, by creating a contingency table in StatCrunch.
Figure 2 displays the contingency table for 100 responses from a two-question survey. The first question is “What is your gender?” and the second question is “Do you like Stats?”
| Yes (like Stats) |
No (do not like Stats) |
Row Totals | |
| Female | 35 | 25 | 60 |
| Male | 20 | 20 | 40 |
| Column Totals | 55 | 45 | 100 |
Figure 2. Contingency Table: Gender vs. Stats
Note the following frequencies provided by the contingency table in Figure 4:
- A total of 60 Females and 40 Males are surveyed.
- A total of 55 people say Yes they like Stats, while 45 people say No they do not like Stats.
- There are 35 people who are Female and say Yes they like Stats.
- There are 25 people who are Female and say No they do not like Stats.
- There are 20 people who are Male and say Yes they like Stats.
- There are 20 people who are Male and say No they do not like Stats.
Because the row totals describe the total frequencies of Females and Males, we consider Gender to be the row variable. Because the column totals describe the total frequencies of “Yes like Stats” and “No do not like Stats” we consider Stats to be the column variable.
Consider the probability experiment of selecting one person at random and asking that person to complete the survey’s two questions, “What is your gender?” and “Do you like Stats?”. Note the following probabilities (relative frequencies) provided by the contingency table in Figure 4:
Probabilities involving one event:
- P (person selected is Female) = 60/100 = (row total/ grand total) = 0.60
- P (person selected is Male) = 40/100 = (row total/ grand total) = 0.40
- P (person selected says Yes-likes Stats) = 55/100 = (column total/ grand total) = 0.55
- P (person selected says No do not like Stats) = 45/100 = (column total/ grand total) = 0.45
Probabilities involving two events separated by “And”:
- P (person selected is Female and says Yes likes Stats) = 35/100 = (common cell count inside table/ grand total) = 0.35
- P (person selected is Female and says No do not like Stats) = 25/100 = (common cell count inside table/ grand total) = 0.25
- P (person selected is Male and says Yes likes Stats) = 20/100 = (common cell count inside table/ grand total) = 0.20
- P (person selected is Male and says No do not like Stats) = 20/100 = (common cell count inside table/ grand total) = 0.20
Probabilities involving two events separated by “Given” (Conditional Probabilities):
- P (person selected says Yes likes Stats given the person is Female) = P (Yes/Female) = (common cell count inside table/ row total) = 35/60 = 0.58
- P (person selected says No do not like Stats given the person is Female) = P (No/Female) = (common cell count inside table/ row total) = 25/60 = 0.42
- P (person selected is Male given the person says Yes likes Stats) = P (Male/Yes) = (common cell count inside table/ column total) = 20/55 = 0.36
- P (person selected is Female given the person says Yes likes Stats) = P (Female/Yes) = (common cell count inside table/ column total) = 35/55 = 0.64
Tests for Independence
- The contingency table data can be used to test to see whether events are independent events. For example, check to see if the two events, Female and Yes likes Stats, are independent events. Here we want to test to see if P (Yes) = P (Yes/Female).
- Since P (Yes) = 0.55 while P (Yes/ Female) = 0.58 these two probabilities are not equal, so we can conclude that the two events, Female and Yes-likes Stats, are not independent events. Alternatively stated, there is a relation between the two events. If we know that the person selected at random is a female, the chances of that person liking statistics are increased from 0.55 to 0.58.
Probabilities involving two events separated by “Or”:
- P (person selected is Female or says Yes likes Stats) = ((row total + column total − common cell count inside table)/ grand total) = ((60 + 55 − 35)/100) = 80/100 = 0.80
The next exercise will show you how to use StatCrunch to create a contingency table so that various probabilities can be determined.
Figure 3 describes a survey questionnaire that was completed by the 210 staff working at a small college. The survey responses have been entered in a StatCrunch data file called College Giving. This data file is available from the AU Math216 2020 StatCrunch Group folder at statcrunch.com.
| Please check the answers that apply to you (below). | Variable | Text Code |
| 1. Please check your gender. | Gender | |
| ☐ male | ______ M | |
| ☐ female | ______ F | |
| 2. Have you have engaged in volunteer activity this year? | Volunteer | |
| ☐ Yes | _______Y | |
| ☐ No | _______N |
Figure 3. Volunteer survey questionnaire.
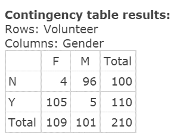
Task 3. Exercise: Create a contingency table for the survey responses in the College Giving data file, with Gender displayed as the column variable, and Volunteer displayed as the row variable.
The completed contingency table is shown in Figure 4.

Figure 4. Contingency table: Volunteer vs. Gender
Guided Solution 3a
- Open the data file College Giving from the Groups folder on StatCrunch. (For help accessing this resource, see Accessing and Working in StatCrunch on the course home page.)
Guided Solution 3b
Create the contingency table Volunteer vs. Gender:
- With the College Giving data file open in StatCrunch, click on the menu option sequence Stat → Tables → Contingency → With Data
- In the contingency table window that displays:
- In the Row variable box, select Volunteer.
- In the Column variable box, select Gender.
- Click Compute to display the contingency table as displayed in Figure 6 above.
Guided Solution 3c
Copy the contingency table into a Word file.
- Open your Word file ComputerLab2.
- Below the last item, type Contingency Table: Gender vs. Volunteer.
- Copy and paste the contingency table on the next line. (For help with copying StatCrunch data, see Copying Materials from StatCrunch.)
- Save your Word file, ComputerLab2.
Task 4. Interpretation – Empirical Probabilities: Contingency Table: Gender vs. Volunteer
Copy and paste the questions below into your ComputerLab2 Word file, below the last item.
Based on your review of the pasted frequency table, type your answer to each question after the word Solution. (If you need help answering these questions, see the Solutions section that follows them.)
- For each of the following, consider the probability experiment in which a college staff member who completed the two-question survey on gender and volunteer activity is selected at random. (Using your calculator where math computations are required), find the probability that:
the staff member will be a female.
Solution:
the staff member will engage in volunteer activity.
Solution:
the staff member will be a male and will engage in volunteer activity.
Solution:
the staff member will engage in volunteer activity, given that the staff member is a female.
Solution:
the staff member will be a male or will engage in volunteer activity
Solution:
Test to see if the events "female" and "engage in volunteer activity" are independent events.
Solution:
Remember to save your file, ComputerLab2.
Solution 4
-
- Find the probability that the staff member will be a female.
Solution: P(F) = (column total/ grand total) = 109/210 = .519048 - Find the probability that the staff member will engage in volunteer activity.
Solution: P(Y) = (row total/ grand total) = 110/210 = 0.52381 - Find the probability that the staff member will be a male and will engage in volunteer activity
Solution: P(M and Y) = = (common cell count inside table/ grand total) = 5/210 = 0.02381 - Find the probability that the staff member will engage in volunteer activity, given that the staff member is a female.
Solution: P(Y/F) = 105/109 = 0.9633 - Find the probability that the staff member will be a male or will engage in volunteer activity
Solution: P(M or Y) = = ((column total + row total − common cell count inside table)/ grand total) = ((101 + 110 − 5)/210) = 206/210 = .980952
- Find the probability that the staff member will be a female.
Test to see if the events “female” and “engage in volunteer activity” are independent events. Interpret your result.
Solution: Test: P(Y) = P(Y/F)?
P(Y) = 0.52381 while P(Y/F) = .9633
Since these two probabilities are not equal, the two events are NOT independent. In this case, knowing the person selected is a female (in advance) significantly increases the probability that person will engage in volunteer activity (goes from .52381 to .9633).
Activity 3. Compute empirical probabilities in games of chance
You can use StatCrunch to simulate the process of tossing a fair coin repeatedly and then calculating the empirical probability of a toss coming up Heads. This empirical probability will more closely approximate the classical (theoretical) probability of 0.50 as the number of tosses gets very large.
To do this simulation, let 0 represent Heads, and 1 represent Tails. We will use StatCrunch to generate 1000 random numbers (to simulate 1000 tosses of a coin) that can either be 0 or 1. We can then recode the numbers Heads and Tails. Finally, we will use StatCrunch to create a frequency table showing relative frequencies. The relative frequency of the event Heads should approximate the classical probability of 0.50. The greater the number of tosses, the closer the approximation.
Task 5. Exercise: Calculate the empirical probability of tossing Heads.
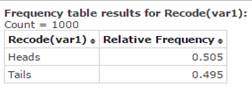
Randomly select 1000 numbers between 0 and 1. Recode 0 as Heads and 1 as Tails. Create a frequency table that displays the relative frequencies for Heads and Tails, as shown in Figure 5.

Figure 5. Frequency table with relative frequencies for “Heads” and “Tails”
Guided Solution 5a
Generate 1000 random numbers
- Open and sign on to StatCrunch. (For help, see Accessing and Working in StatCrunch on the course home page.)
- With the window showing a blank data table, click the menu sequence Applets → Random numbers.
- In the Random number window that appears:
- Type 0 in the Minimum value box.
- Type 1 in the Maximum value box.
- Type 1000 in the Sample size box.
- Select the Allow repeats option.
- Click Compute.
- An Options window will open displaying the 1000 randomly selected zeros and ones.
Guided Solution 5b
Recode 0 as Heads and 1 as Tails.
- In the Options window displaying the 1000 random numbers, select the first number in the list and, holding down your left mouse button, scroll down to select all 1000 numbers.
- With all 1000 numbers selected, press Ctrl+C to copy these numbers.
- In the blank data table, click your left mouse pointer in the first cell under Var1; then press Ctrl+V to paste the 1000 numbers in the first column under Var1.
- Select the menu sequence Data → Recode.
- In the Recode Columns window that displays:
- In the Select column box, select Var1.
- Click Compute to display a Recode Columns window.
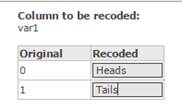
- In the Recoded box (second column, first row), type Heads (see Figure 6).
In the Recoded box (second column, second row), type Tails (see Figure 6).

Figure 6. Recode Window
- Click Compute to create a second variable, Recode (Var1), in the second column of the data table. The values Heads and Tails should display in this new column.
Guided Solution 5c
Create a frequency table for Recode (Var1)
- With the Recode(Var1) column displayed in the data table, click the menu sequence Stat → Tables → Frequency.
- In the Frequency Table window that displays:
- In the Select column box, select the variable Recode (Var1).
- In the Statistics box, click on Relative frequency.
- Click Compute to display a frequency table similar to Figure 5 above. (Note that your relative frequencies will likely be different than those in Figure 5, as you will have generated different random numbers than the course author generated.)
Guided Solution 5d
Copy the Frequency Table into a Word file.
Here, you will open the Word file ComputerLab2 and then copy and paste the frequency table created in StatCrunch into this document, after the bottom item.
- For help copying StatCrunch data, see Copying Materials from StatCrunch.
- Save your Word document, ComputerLab2.
Task 6. Interpretation Question: Relative Frequencies for Heads and Tails
Copy and paste the question below into your ComputerLab2 Word file, below the last item.
Based on your review of the pasted frequency table, type your answer to the question after the word Solution. (If you need help answering the question, see the Solutions section that follows.)
Find the probability that a Heads will display, based on the frequency table you created.
Solution:
Solution 6
- Based on Figure 5 above, the answer would be 0.505. Note that your answer will differ based on your own random numbers generated.
